
Background
This lesson is part of the Plastic Pollution and You curriculum developed by the educators from New York Sea Grant.
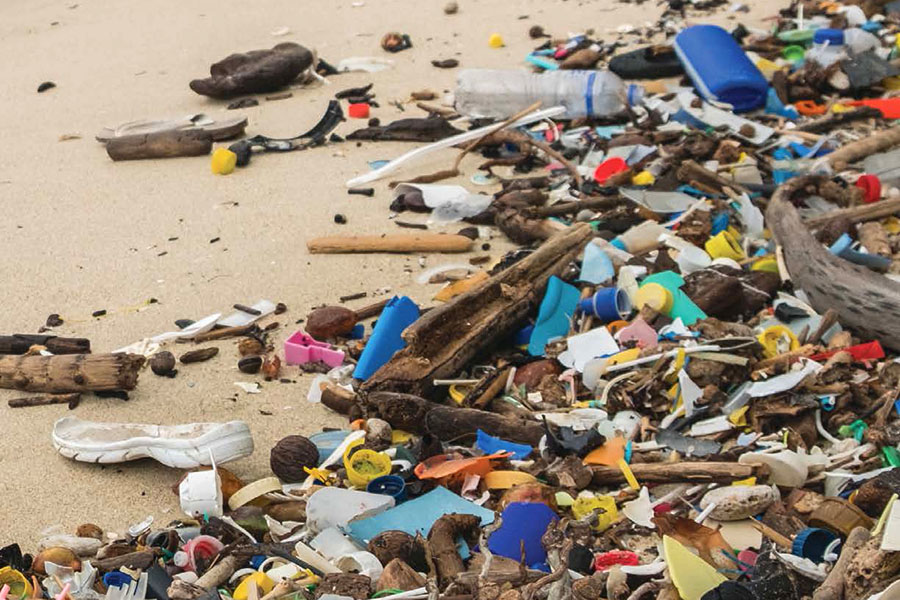
Students will record what type of plastic pollution they find in their community as they walk through their neighborhood, around their school, or in a local park, shoreline or beach using a map. This data collection will indicate the type(s) of pollution found, identify its potential sources, and begin to think about local solutions to plastic pollution.

Objectives
Students will:
- indicate and record types of plastic pollution found in community
- identify potential sources of types of plastic found
- consider possible local solutions to plastic pollution
Lesson Alignment
This lesson is part of the Plastic Pollution and You curriculum and is aligned to the following standards document:
New York State P-12 Science Learning Standards & Next
Generation Science Standards | LINK
SCI: 5-ESS3-1, MS-ESS3-3, HS-ESS3-4
New York State Social Studies Learning Standards and K-12
Framework | LINK
SS: 8.8.c, 10.9.a, 10.9.b, S5-KI #4
Materials
Access printed copies or electronic versions of lesson materials below.
- Map of neighborhood, school, park, shoreline, or beach (printed or hand drawn)
- Clipboard, pen/pencil
- Gloves, bags, buckets
- Smart phone to access Google Maps, Google My Maps, and/ or the camera feature (optional)
Plastic Pollution Prediction Chart
One per student
Plastic Pollution Tracking Sheet
One per student
NOAA Story Map
This is an additional resource
Plastic Pollution and You
Full Curricula
Time Required
This lesson may require multiple class periods to complete.
Activity Set-Up
Select area(s) for data collection and print out Google maps of the area or have students draw a map by hand.
Lesson
- Have students examine the map of their data collection area and complete the first four columns of the Plastic Pollution Prediction Chart.
- Recommendation: If using your school campus, consider speaking with maintenance and custodial staff about areas that tend to accumulate trash and litter if not regularly maintained. Potentially invite these staff members to speak with the students about how much work is required to keep these areas free of debris.
- For non-school campus locations, survey the area prior to student visit to assess the amount and location(s) of plastic pollution.
- If students are working independently, provide each student with: a printed map, plastic pollution tracking sheet, clipboard, and pen. OR If working as a class, you can divide different subsections within your area to each group of students. Each group should have: a printed map, tracking sheet, pen, clipboard, gloves, and optionally a bucket to collect the plastic pollution.
- As students walk, have them mark each location on the map where they find a piece of plastic pollution with its own letter (e.g. Location A). On the plastic pollution tracking sheet, have them record the type and number of items found at that location.
- Option: Have students pick up the plastic pollution item and place it in the bucket.
- Bonus: If a camera or smartphone is available, take a picture of the item(s).Repeat this process as time allows or until your entire area has been completed.
- If students covered different sections of the area, have them bring their maps together to compile them and tally up all of the items that were recorded and collected.
- If using Google My Maps, students can upload photos to each location.
- If students covered the same area, you can compare the maps and tracking sheets.
- Following the mapping and data collection process, have students fill out the fifth column of the Plastic Pollution Prediction Chart to see if their predictions were correct.
NOTE:
Students can also contribute their data to community science marine debris mobile applications like NOAA’s Marine Debris Tracker | LINK or the Ocean Conservancy’s CleanSwell | LINK.
Optional Activity:
- Have students repeat this activity over an extended period of time to monitor the amount of pollution in a given area (ie: daily for a week, weekly for a month, etc.). Have students compare how the data and maps do or do not change.
- Teachers can save data and maps for comparison to future data collection.
- Students can design or refine technological solutions or behavior change campaigns, and evaluate if the solutions have an impact on plastic pollution.
This lesson is part of a larger curriculum, Plastic Pollution and You.